Introduction
The integration of genomic information with quantitative experimental data is a key component of systems biology. The genomes of prokaryotes contain many structures of interest, such as operons, pathogenicity islands and prophage sequences, whose behaviour is of interest during infection and disease. ProGenExpress allows researchers to easily and quickly visualize quantitative measurements, such as those produced by microarray experiments, in the context of the genome organization of sequenced prokaryotes. ProGenExpress is demonstrated here integrating the Salmonella typhimurium genome with a publicly available microarray dataset.
|
Implementation
ProGenExpress is written as an R package, providing seamless integration with analysis methods and data storage classes available as part of the bioconductor project, such as the limma and marray packages available for microarray analysis. Alternatively, R provides many methods for reading in data from text files, databases and Excel.
ProGenExpress can read information relating to the genome organisation of a species either from NCBI .ptt files (e.g. S typhimurium LT2 .ptt) or the RefSeq entry (e.g. S typhimurium LT2 RefSeq), for the majority of fully sequenced bacterial species. Alternatively, users can import their own genome data from a text file.
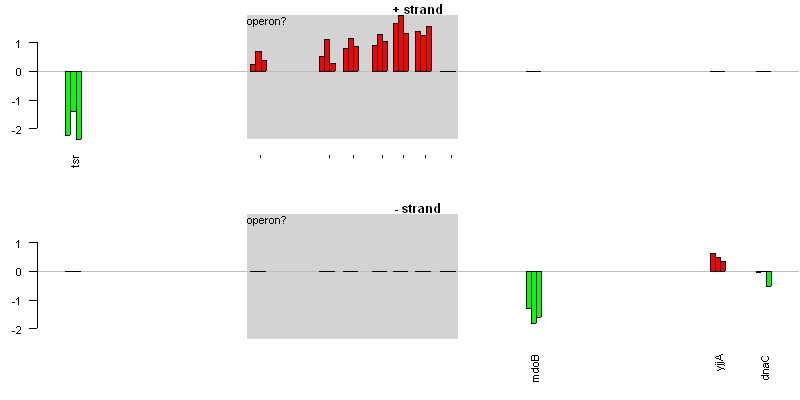
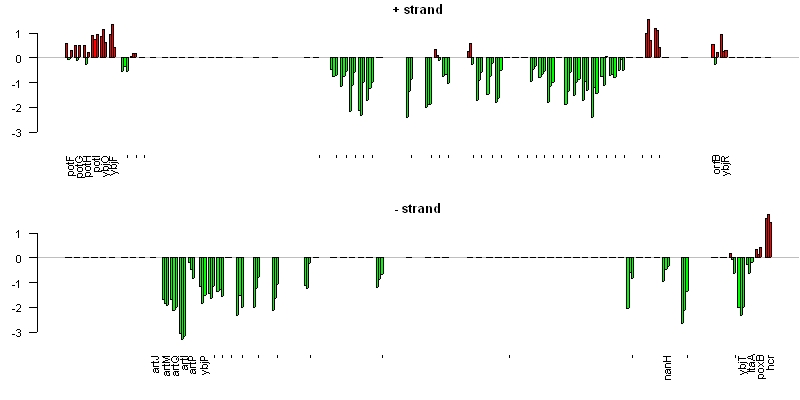
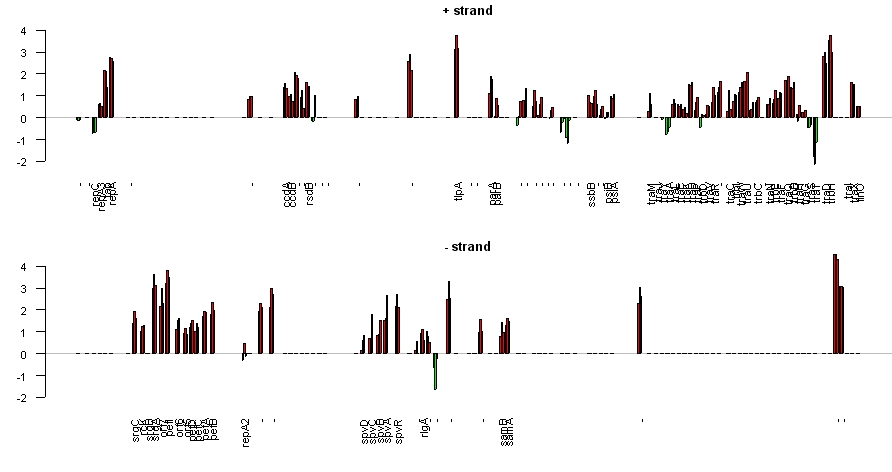
Once combined, users can choose to visualise sections of the genome, selected either by gene name or base range. Each strand is represented as a bar-plot, with one bar per gene per experiment, allowing time-course or complex strain/treatment experiments to be visualised in the context of the genome. Genes are ranked by their start position on the genome, and gaps between genes are representative of intergenic distance.
|
Download and Documentation
ProGenExpress is available for both Windows and Linux, for R versions 2.0 and above.
Download ProGenExpress.
A simple tutorial is provided here (HTML or Word). As an R package, ProGenExpress contains a significant amount of documentation which may be accessed through the R help system, and this is also provided here.
ProGenExpress comes packaged with data relating to the genome of Salmonella typhimurium LT2, and microarray data from the IFR detailing gene expression measurements from 4, 8 and 12 hours post macrophage infection. The tutorial details how these data sets can be combined and visualised.
ProGenExpress can analyse combined genome/microarray data in an attempt to discover regions of interest, such as operons or pathogenicity islands. The package does this by looking for clusters of genes which are close together on the genome and which display similar expression patterns. Using the Salmonella data set above, ProGenExpress identifies over 200 potential regions of interest greater than 4 genes in length. More information is in the tutorial.
|
References
Eriksson S., Lucchini S., Thompson A., Rhen M. & Hinton J. C. D.
(2003) Unravelling the biology of macrophage infection by gene
expression profiling of intracellular Salmonella enterica.
Molecular Microbiology 47 (1) 103-118
|
Examples
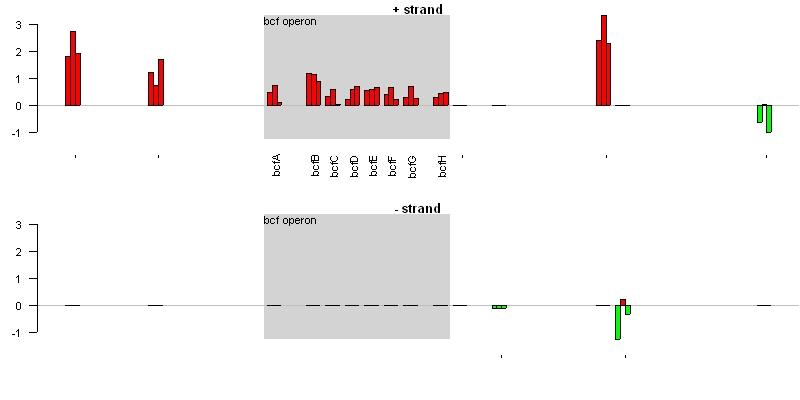
| The bcfA - bcfH operon: |
 |
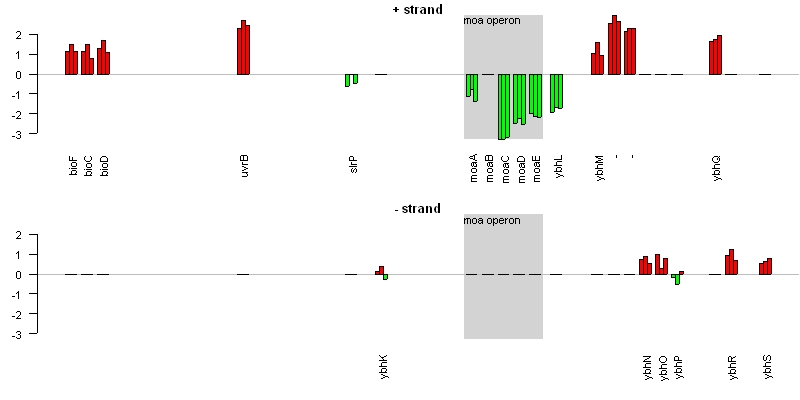
| The moaA - moaE operon (molybdopterin biosynthesis): |
 |
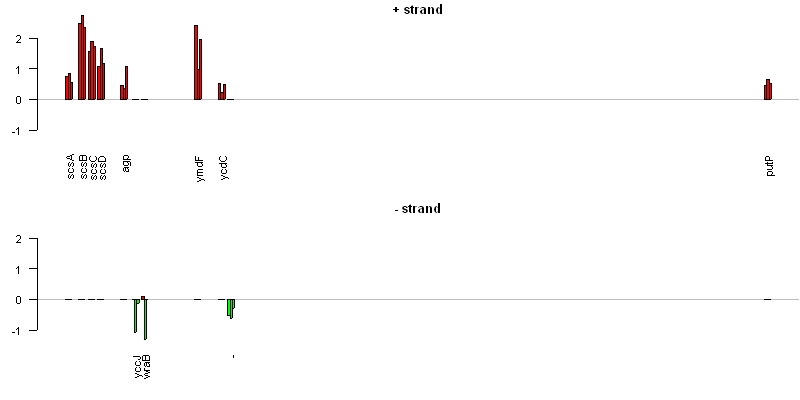
| Plot demonstrating intergenic distance: |
 |
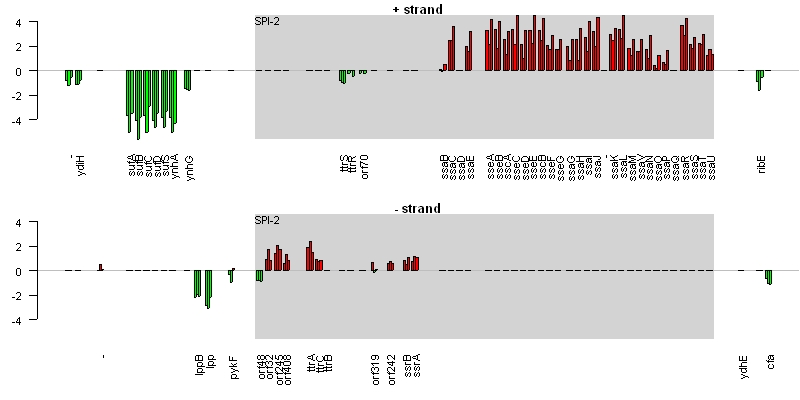
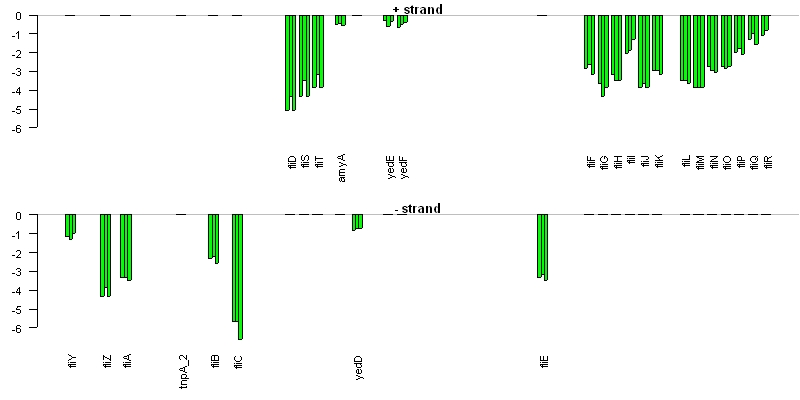
| Extreme down-regulation of genes involved in flagella biosynthesis: |
 |
| The suf operon and Salmonella Pathogenicity Island II: |
 |
| More negative expression of genes involved in flagella biosynthesis: |
 |
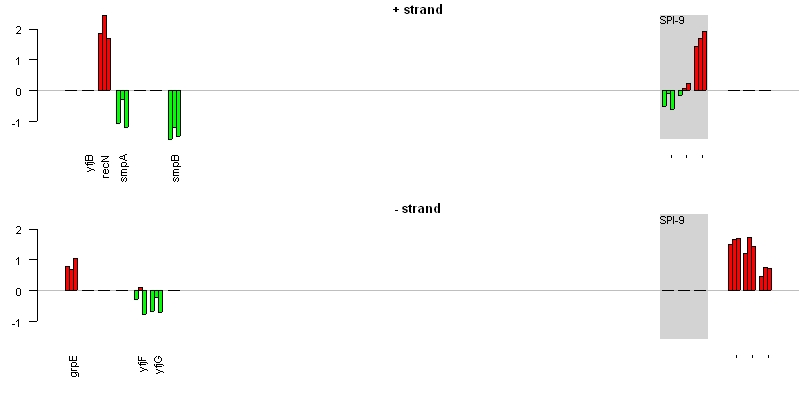
| Salmonella Pathogenicity Island 9 and the large amount of "empty" DNA preceding it: |
 |
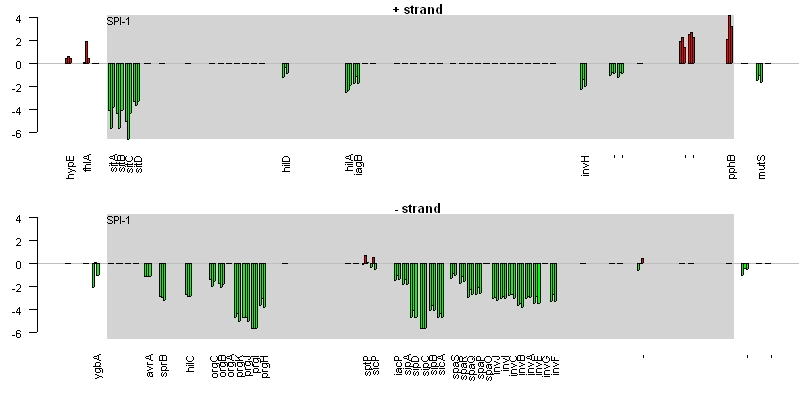
| Large scale down-regulation of Salmonella Pathogenicity Island 1: |
 |
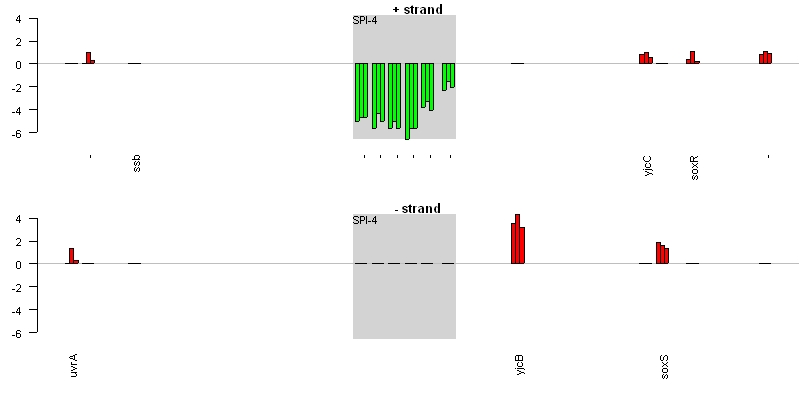
| Down-regulation of Salmonella Pathogenicity Island 4: |
 |
| A novel unannotated operon?: |
 |
| A large cluster of down-regulated genes - new operons?: |
 |
| Gene Expression measurements for entire Salmonella typhimurium LT2 plasmid pSLT: |
 |
| Gene Expression measurements for the entire Salmonella typhimurium genome, with 10 pathogenicity islands highlighted: |
WARNING - this is a VERY large file. You may need to turn OFF automatic image resizing in Internet Explorer (Tools | Internet Options | Advanced) |
| Click Here |
|
